")
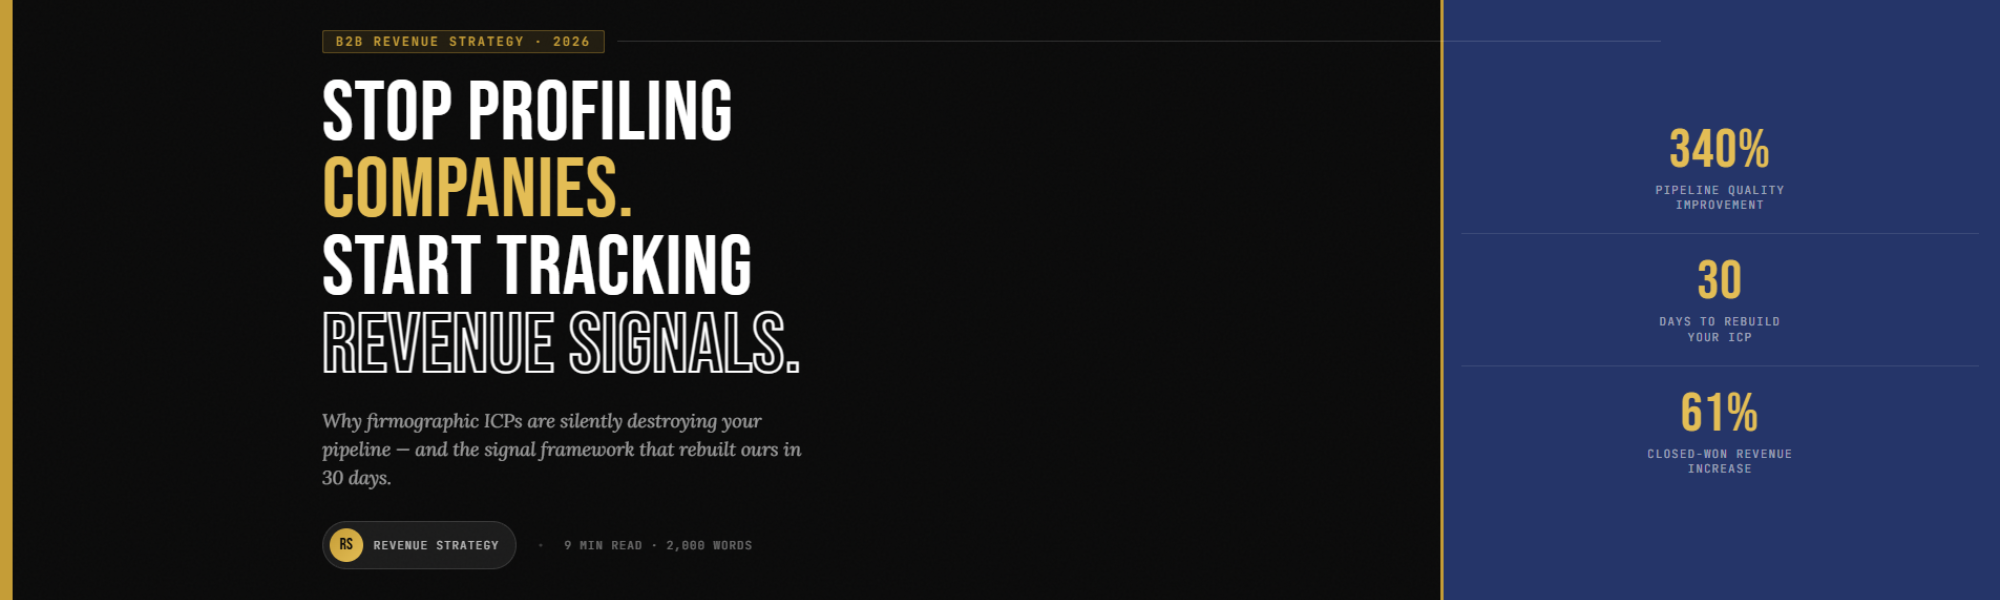
We had 4,800 “perfect” accounts in our CRM.
Right industry. Right size. Right tech stack. Every firmographic box checked.
We generated 94 demos in Q3. Sales closed 6.
Not 6%. Six deals.
The problem wasn’t our messaging. It wasn’t our sequences. It wasn’t our reps.
It was that we were targeting companies that looked like our best customers instead of companies that were behaving like them.
That one distinction cost us two years of pipeline.
The Core Flaw Nobody Talks About
Firmographics describe what a company is.
Revenue signals describe what a company is doing right now.
In B2B, timing beats identity every single time.
A 500-person SaaS company in your perfect revenue band that just renewed with a competitor? Terrible prospect.
A 90-person manufacturer outside your typical verticals whose CMO just posted about broken pipeline metrics, just hired a VP of RevOps, and has 4 SDR roles open?
That’s a live buyer. Right now. Today.
Your firmographic ICP sends you to the first company. Revenue signals send you to the second.
The 3 Signal Categories That Actually Predict Buyers
After analyzing 340 closed-won accounts over 18 months, we found three behavioral categories that outperformed every firmographic criterion we’d ever used.
⚡ Growth Motion Signals — 10 pts each
Head count growth in sales/RevOps >15% in 90 days
New CRO, VP Sales, or CMO hire
3+ open SDR/AE roles simultaneously
New funding with growth-stage language
🔥 Pain Activation Signals — 15 pts each
Competitor contract renewal window approaching
Public vendor complaints on G2 or Capterra
Leadership publishing content about your solution category
Attendance at events in your solution space
👁 Engagement Signals — 5 pts each
Anonymous web visitors from target accounts
Third-party intent spikes on category keywords
Social engagement with your content or competitors’
The rule: Any account hitting 25+ points gets same-week outreach. No committee. No extra qualification step.
25 points means they’re in motion. Your window is narrow.
💡 “A company posting 4 SDR jobs is telling you they’re about to spend money on pipeline. That’s the most honest buying signal in B2B — and it costs nothing to read.”
How to Rebuild Your ICP in 30 Days
No data science team needed. No six-figure tech investment.
Days 1–7: Pull your last 60 closed-won accounts. Go back 90 days before first contact. Manually audit each for behavioral signals. Document what appears in 80%+ of accounts — those are your leading indicators.
Days 8–14: Build a weighted scoring matrix from what you found. Your matrix should reflect your buyer’s behavioral fingerprint, not a generic template.
Days 15–21: Run your current pipeline through the model. You’ll likely find 20–40% of accounts don’t qualify. You’ll also find high-scoring accounts you’ve been ignoring. Shift resources immediately.
Days 22–30: Rewrite your ICP definition. Firmographics set the floor. Signal score of 20+ gets you in the room.
What Changed 12 Months Later
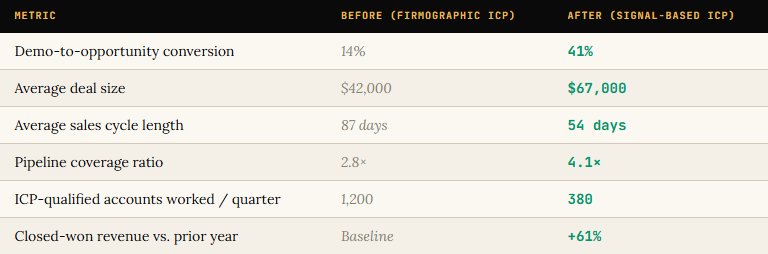
We worked one-third the accounts and closed 61% more revenue.
The ICP wasn’t broken because it was too narrow.
It was broken because it was measuring the wrong things.
The Shift
The B2B companies winning right now aren’t targeting better.
They’re listening better.
You already have most of the data you need. LinkedIn, G2, your web analytics, your intent platform — it’s all pointing at your next 50 best customers.
You’re just not reading it yet.
Start with 10 recent closed-won accounts. Spend one hour per account in the 90-day pre-contact window. Find the behavioral evidence.
By the end of that exercise, you’ll know your signal fingerprint.
And you’ll never look at a firmographic ICP the same way again.
What’s the strongest buying signal you’ve seen predict a closed deal?
Drop it in the comments
If this changed how you think about ICP strategy, follow Us for weekly frameworks on B2B revenue architecture and demand generation.

